Market Outlook
February 05, 2018
Market Cues
Domestic Indices
Chg (%)
(Pts)
(Close)
Indian markets are likely to open negative tracking global indices and SGX Nifty.
BSE Sensex
(2.3)
(840)
35,067
US Stocks continue to see considerable weakness after an early move to the
Nifty
(2.3)
(256)
10,761
downside. The major averages have slid firmly into negative territory following the
Mid Cap
(4.0)
(696)
16,575
mixed performance seen in the previous session. The Dow Jones is down by 1.5% to
Small Cap
(4.6)
(870)
17,848
close at 25,787 and the Nasdaq Composite edged down to 1.1%, to 7,302.
Bankex
(2.9)
(878)
29,910
U.K. shares were modestly lower as earnings proved to be a mixed bag and the U.S.
government bond sell-off entered a second session on optimism over global growth
Global Indices
Chg (%)
(Pts)
(Close)
and rising expectations of inflation. The FTSE 100 was down by 0.3% to close at
Dow Jones
(2.5)
(666)
25,521
7,474.
Nasdaq
(2.0)
(145)
7,241
On domestic front, Indian shares succumbed to heavy selling pressure as rising oil
FTSE
(0.6)
(47)
7,443
prices, fiscal deficit woes, and the Budget proposal to levy long-term capital gains
Nikkei
(0.9)
(212)
23,275
tax on equities. The Sensex ended on a downside front of 2.3% at 35,067 while the
Hang Seng
(0.1)
(40)
32,602
Nifty ended at 10,761 with a downside of 2.3%.
Shanghai Com
0.4
15
3,462
News Analysis
Advances / Declines
BSE
NSE
Retail inflation for industrial workers up 4% in December
Advances
307
135
Detailed analysis on Pg2
Declines
2,565
1,716
Investor’s Ready Reckoner
Unchanged
120
31
Key Domestic & Global Indicators
Stock Watch: Latest investment recommendations on 150+ stocks
Volumes (` Cr)
Refer Pg5 onwards
BSE
5,945
NSE
47,472
Top Picks
CMP
Target
Upside
Company
Sector
Rating
(`)
(`)
(%)
Net Inflows (` Cr)
Net
Mtd
Ytd
Blue Star
Capital Goods
Buy
718
867
20.7
FII
1,166
1,166
14,150
Dewan Housing Finance
Financials
Buy
519
712
37.1
Asian Granito
Other
Buy
533
651
22.2
*MFs
1,051
7,386
7,386
Navkar Corporation
Other
Buy
174
265
52.4
KEI Industries
Capital Goods
Buy
374
436
16.7
Top Gainers
Price (`)
Chg (%)
More Top Picks on Pg4
Coromandel
555
1.9
Key Upcoming Events
Shoperstop
530
1.8
Previous
Consensus
Date
Region
Event Description
Gppl
144
1.5
Reading
Expectations
Naukri
1,347
1.2
Feb05
India
RBI Reverse Repo rate
5.75
Feb07
Germany PMI Services
57.00
57.00
Techm
617
1.1
Feb07
India
RBI Repo rate
6.00
Feb07
China
Exports YoY%
10.90
11.30
Top Losers
Price (`)
Chg (%)
Feb08
India
RBI Cash Reserve ratio
4.00
More Events on Pg7
Pcjeweller
366
(24.4)
Gmrinfra
19
(15.4)
Bomdyeing
192
(13.4)
Jindalsaw
131
(13.2)
Rnaval
39
(12.6)
As on February 02 2018
Market Outlook
February 05, 2018
News Analysis
Retail inflation for industrial workers up 4% in December
Retail inflation for industrial workers rose to 4 per cent in December, 2017 from
2.23 per cent a year ago, mainly due to increase in the price of certain food items
and electricity charges.
"The year-on-year inflation measured by monthly CPI-IW (Consumer Price Index-
Industrial Workers) stood at 4 per cent for December 2017 as compared to 3.97
per cent for previous month (November 2017) and 2.23 per cent during the
corresponding month (December 2016) of the previous year".
According to reports, the maximum downward pressure to the change in current
index came from food group contributing (-) 2.37 percentage points to the total
change.
Economic and Political News
Retail inflation for industrial workers up 4% in Dec on food price rise
Despite hike in MSP, inflationary impact to be moderate: Report
Anti-dumping duty likely on Chinese exports of chemical used in plastics
Soon, Goa government to provide sanitary pads at schools, construction
sites
Corporate News
Jio tops 4G speed in Nov for 11th straight month; beats rivals Voda, Airtel
JSPL cites iron ore supply bottleneck, wants Odisha to reopen closed mines
Government wants to finish privatisation of Air India by Dec 2018
Thums Up goes global: Parent Coca-Cola to launch it in South East Asia
Market Outlook
February 05, 2018
Quarterly Bloomberg Brokers Consensus Estimate
Tata Motors Ltd - Feb 05, 2018
Particulars ( ` cr)
3QFY18E
3QFY17
y-o-y (%)
2QFY18
q-o-q (%)
Sales
73,400
63,933
14.8
70,690
3.8
EBIDTA
8,966
4,815
86.2
9,009
(0.5)
%
12.2
7.5
12.7
PAT
2,349
111
2016.2
2,501
(6.1)
BOSCH Ltd. - Feb 05, 2018
Particulars ( ` cr)
3QFY18E
3QFY17
y-o-y (%)
2QFY18
q-o-q (%)
Sales
2,978
2,671
11.5
2,811
5.9
EBIDTA
402
266
51.1
507
(20.7)
%
13.5
9.9
18.1
PAT
317
218
45.4
353
(10.1)
Colgate Palmolive Ltd. - Feb 05, 2018
Particulars ( ` cr)
3QFY18E
3QFY17
y-o-y (%)
2QFY18
q-o-q (%)
Sales
1,013
874
15.9
1,084
(6.5)
EBIDTA
262
214
22.4
300
(12.7)
%
25.8
24.5
27.7
PAT
156
127
22.8
177
(11.8)
Market Outlook
February 05, 2018
Top Picks
Market Cap
CMP
Target
Upside
Company
Rationale
(` Cr)
(`)
(`)
(%)
Strong growth in domestic business due to its leade`hip
in acute therapeutic segment. Alkem expects to launch
Alkem Laboratories
26,185
2,190
2,441
11.5
more products in USA, which bodes for its international
business.
We expect the company would report strong profitability
Asian Granito
1,603
533
651
22.2
owing to better product mix, higher B2C sales and
amalgamation synergy.
Favorable outlook for the AC industry to augur well for
Cooling products business which is out pacing the
Blue Star
6,889
718
867
20.7
market growth. EMPPAC division's profitability to
improve once operating environment turns around.
With a focus on the low and medium income (LMI)
consumer segment, the company has increased its
Dewan Housing Finance
16,293
519
712
37.1
presence in tier-II & III cities where the growth
opportunity is immense.
Loan growth is likely to pick up after a sluggish FY17.
Lower credit cost will help in strong bottom-line growth.
Karur Vysya Bank
8,115
112
160
43.2
Increasing share of CASA will help in NIM
improvement.
High order book execution in EPC segment, rising B2C
KEI Industries
2,927
374
436
16.7
sales and higher exports to boost the revenues and
profitability
Expected to benefit from the lower capex requirement
Music Broadcast
2,134
374
475
27.0
and 15 year long radio broadcast licensing.
Massive capacity expansion along with rail advantage
Navkar Corporation
2,618
174
265
52.4
at ICD as well CFS augur well for the company
Strong brands and distribution network would boost
Siyaram Silk Mills
2,943
628
851
35.5
growth going ahead. Stock currently trades at an
inexpensive valuation.
Market leadership in Hindi news genre and no.
2
viewership ranking in English news genre, exit from the
TV Today Network
2,684
450
500
11.1
radio business, and anticipated growth in ad spends by
corporate to benefit the stock.
After GST, the company is expected to see higher
volumes along with improving product mix. The Gujarat
Maruti Suzuki
2,71,881
9,000
10,619
18.0
plant will also enable higher operating leverage which
will be margin accretive.
We expect loan book to grow at 24.3% over next two
GIC Housing
2,197
408
655
60.5
year; change in borrowing mix will help in NIM
improvement
We expect CPIL to report net Revenue/PAT CAGR of
~17%/16% over FY2017-20E mainly due to healthy
6,898
311
400
28.8
growth in plywood & lamination business, forayed into
Century Plyboards India
MDF & Particle boards on back of strong brand &
distribution network.
We expect sales/PAT to grow at 13.5%/20% over next
LT Foods
2,839
89
128
44.2
two years on the back of strong distribution network &
addition of new products in portfolio.
We expect sales/PAT to grow at 13%/16% over next two
years on the back of strong healthy demand in writing
Ruchira Papers
382
170
244
43.2
& printing paper and Kraft paper. Further, China had
banned making paper from waste pulp which would
benefit Indian paper companies.
We expect financialisation of savings and increasing
Aditya Birla Capital
38713
167
230
37.7
penetration in Insurance & Mutual fund would ensure
steady growth.
Source: Company, Angel Research
Market Outlook
February 05, 2018
Fundamental Call
Market Cap
CMP
Target
Upside
Company
Rationale
(` Cr)
(`)
(`)
(%)
CCL is likely to maintain the strong growth trajectory
CCL Products
3,670
276
360
30.5
over FY18-20 backed by capacity expansion and new
geographical foray
We forecast Nilkamal to report top-line CAGR of ~9%
to `2,635cr over FY17-20E on the back of healthy
Nilkamal
2,567
1,720
2,178
26.6
demand growth in plastic division. On the bottom-line
front, we estimate ~10% CAGR to `162cr owing to
improvement in volumes.
We expect sales/PAT to grow at 9%/14% over next two
years on the back of healthy demand growth in
Shreyans Industries
236
171
247
44.5
printing. Further, China had banned making paper
from waste pulp which would benefit Indian paper
companies.
The prism has diversified exposure in the different
segment such as Cement, Tile & ready mix concrete.
Prism Cement
6,388
127
160
26.1
Thus we believe, PCL is in the right place to capture
ongoing government spending on affordable housing
and infrastructure projects.
Source: Company, Angel Research
Market Outlook
February 05, 2018
Key Upcoming Events
Result Calendar
Date
Company
February 05, 2018
Bosch India, Colgate, MM Forging
February 06, 2018
Tata Chemicals, Hero Motocorp, Apollo Tyres, Siemens, Blue Star, KEC International, PNB, REC., BOM, Lupin
Source: Bloomberg, Angel Research
Global economic events release calendar
Bloomberg Data
Date
Time
Country
Event Description
Unit
Period
Last Reported
Estimated
Feb 05, 2018
2:30 PMIndia
RBI Reverse Repo rate
%
Feb 7
5.75
Feb 07, 2018
2:25 PMGermany PMI Services
Value
Jan F
57.00
57.00
2:30 PMIndia
RBI Repo rate
%
Feb 7
6.00
China
Exports YoY%
% Change
Jan
10.90
11.30
Feb 08, 2018
2:30 PMIndia
RBI Cash Reserve ratio
%
Feb 7
4.00
7:00 PMUS
Initial Jobless claims
Thousands
Feb 3
230.00
5:30 PMUK
BOE Announces rates
% Ratio
Feb 8
0.50
0.50
Feb 09, 2018
3:00 PMUK
Industrial Production (YoY)
% Change
Dec
2.50
0.30
7:00 AMChina
Consumer Price Index (YoY)
% Change
Jan
1.80
1.50
Feb 12, 2018
5:30 PMIndia
Industrial Production YoY
% Change
Dec
8.40
Feb 13, 2018
3:00 PMUK
CPI (YoY)
% Change
Jan
3.00
Feb 14, 2018
3:30 PMEuro Zone Euro-Zone GDP s.a. (QoQ)
% Change
4Q P
0.60
12:00 PMIndia
Monthly Wholesale Prices YoY%
% Change
Jan
3.58
7:00 PMUS
Consumer price index (mom)
% Change
Jan
0.10
0.30
12:30 PMGermany GDP nsa (YoY)
% Change
4Q P
2.30
Source: Bloomberg, Angel Research
Market Outlook
February 05, 2018
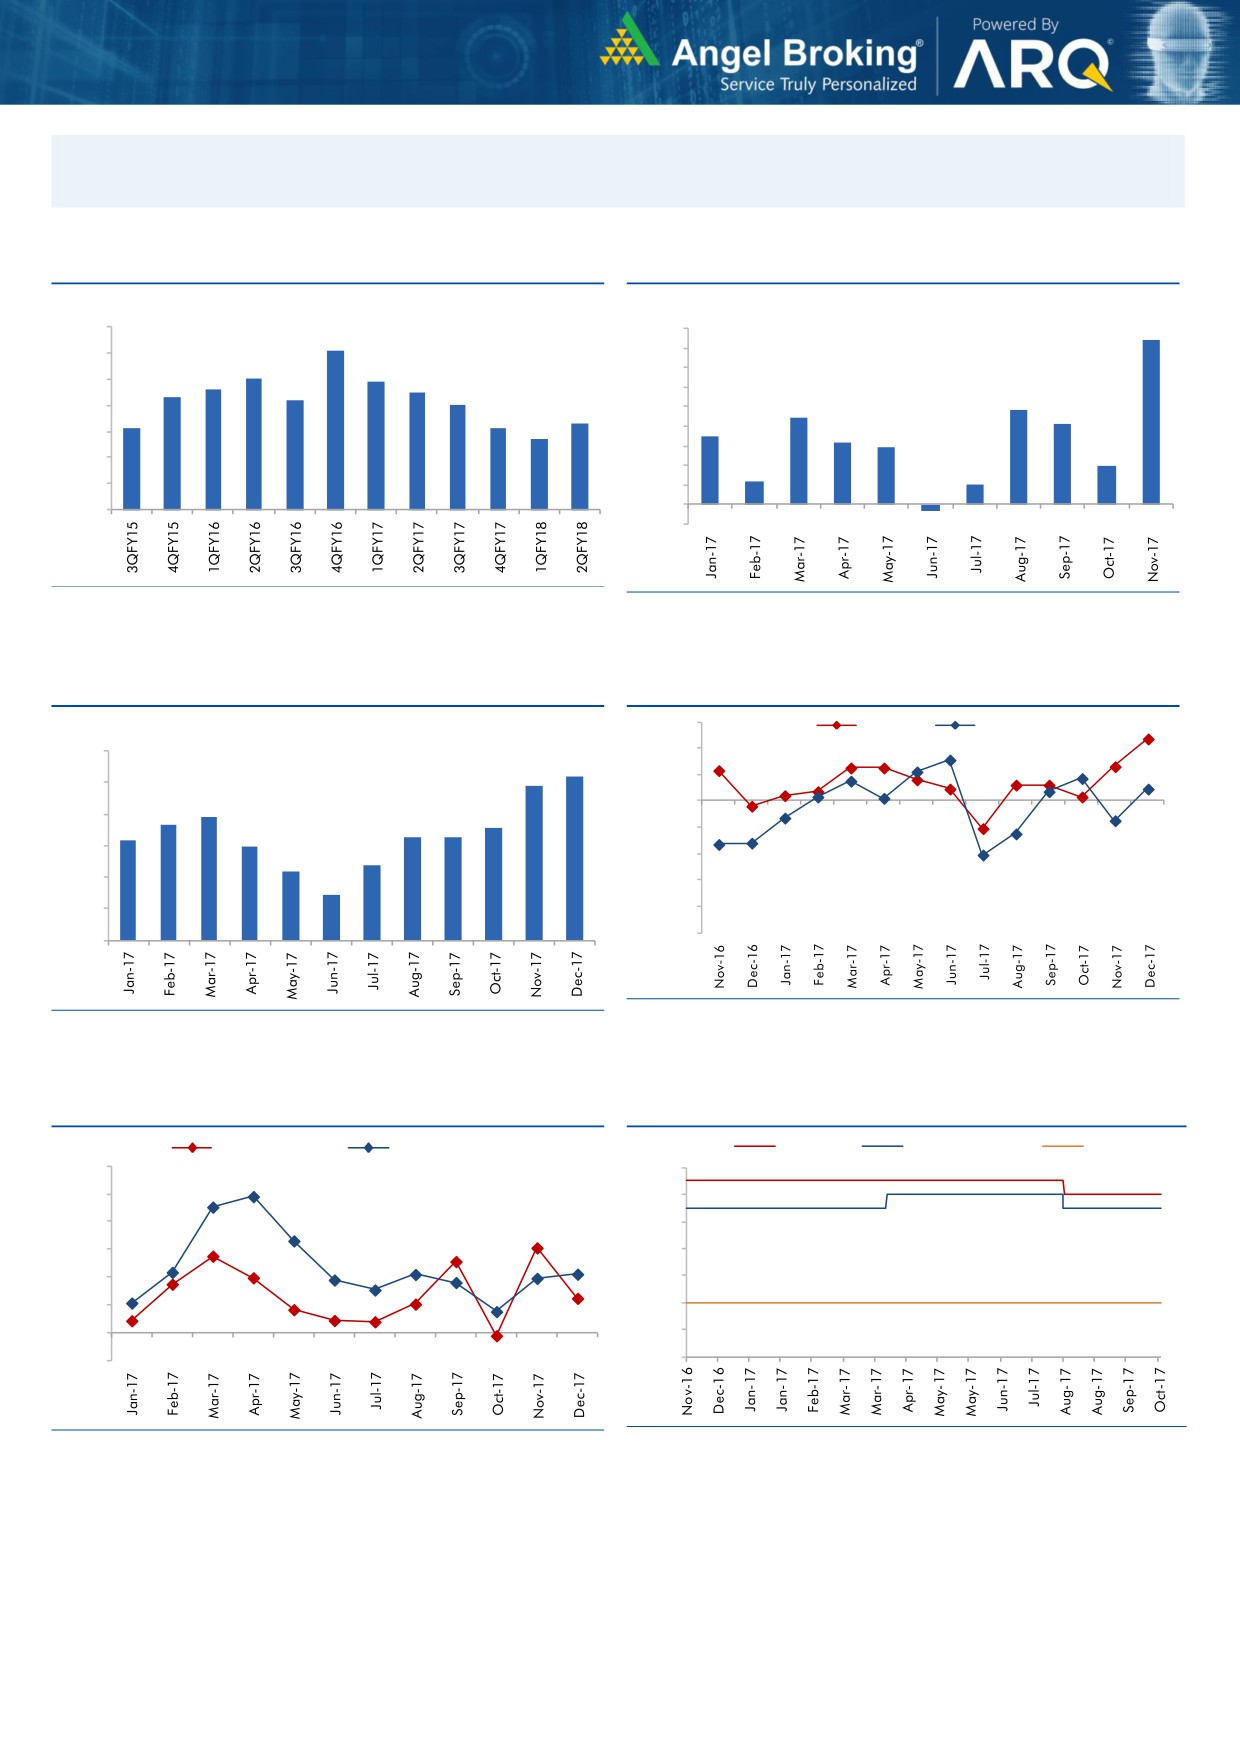
Macro watch
Exhibit 1: Quarterly GDP trends
Exhibit 2: IIP trends
(%)
(%)
10.0
9.0
8.4
9.1
9.0
8.0
8.0
7.9
7.0
7.6
7.5
8.0
7.3
7.2
7.0
6.0
4.8
7.0
6.3
5.0
4.4
4.1
6.1
6.1
5.7
3.5
3.2
6.0
4.0
2.9
3.0
2.0
5.0
2.0
1.2
1.0
4.0
1.0
-
3.0
(1.0)
(0.3)
Source: CSO, Angel Research
Source: MOSPI, Angel Research
Exhibit 3: Monthly CPI inflation trends
Exhibit 4: Manufacturing and services PMI
56.0
Mfg. PMI
Services PMI
(%)
6.0
54.0
5.2
4.9
52.0
5.0
3.9
50.0
3.7
3.6
4.0
3.3
3.3
3.2
3.0
48.0
3.0
2.4
2.2
46.0
2.0
1.5
44.0
1.0
42.0
40.0
-
Source: Market, Angel Research; Note: Level above 50 indicates expansion
Source: MOSPI, Angel Research
Exhibit 5: Exports and imports growth trends
Exhibit 6: Key policy rates
(%)
Exports yoy growth
Imports yoy growth
(%)
Repo rate
Reverse Repo rate
CRR
60.0
6.50
50.0
6.00
40.0
5.50
30.0
5.00
20.0
4.50
10.0
4.00
0.0
3.50
(10.0)
3.00
Source: Bloomberg, Angel Research
Source: RBI, Angel Research
Market Outlook
February 05, 2018
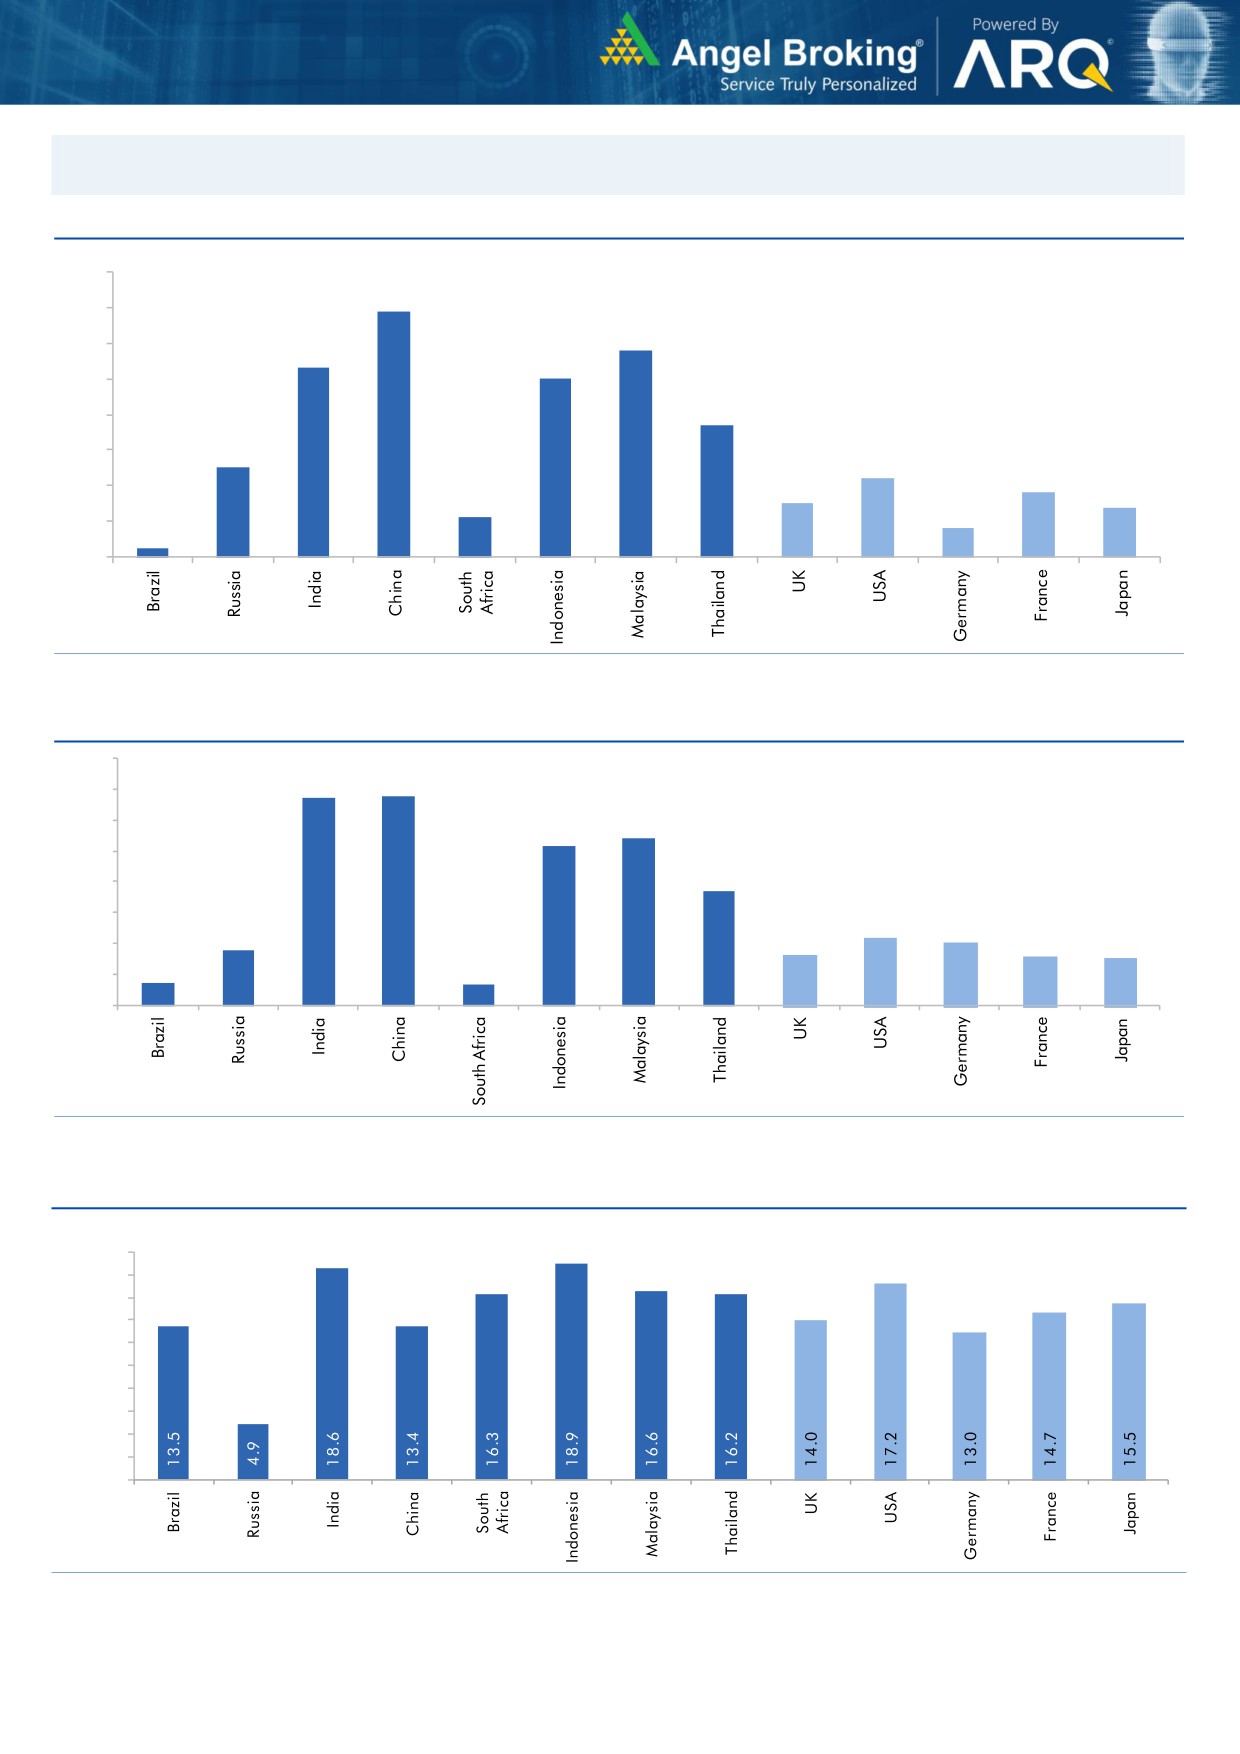
Global watch
Exhibit 1: Latest quarterly GDP Growth (%, yoy) across select developing and developed countries
(%)
8.0
6.9
7.0
5.8
6.0
5.3
5.0
5.0
1.1
3.7
4.0
2.5
3.0
2.2
1.8
2.0
1.5
1.4
0.8
1.0
0.3
-
Source: Bloomberg, Angel Research
Exhibit 2: 2017 GDP Growth projection by IMF (%, yoy) across select developing and developed countries
(%)
6.7
6.8
7.0
6.0
5.4
5.2
5.0
3.7
4.0
3.0
1.8
2.2
2.0
1.7
1.6
2.0
0.7
1.5
0.7
1.0
-
Source: IMF, Angel Research
Exhibit 3: One year forward P-E ratio across select developing and developed countries
(x)
20.0
18.0
16.0
14.0
12.0
10.0
8.0
6.0
4.0
2.0
-
Source: IMF, Angel Research
Market Outlook
February 05, 2018
Exhibit 4: Relative performance of indices across globe
Returns (%)
Country
Name of index
Closing price
1M
3M
1YR
Brazil
Bovespa
84,041
7.9
10.7
27.0
Russia
Micex
2,282
8.2
10.5
2.9
India
Nifty
10,761
3.0
3.2
25.7
China
Shanghai Composite
3,462
2.8
2.7
9.9
South Africa
Top 40
51,908
(1.7)
(2.2)
12.3
Mexico
Mexbol
50,396
1.2
3.2
7.0
Indonesia
LQ45
1,112
5.2
12.1
26.5
Malaysia
KLCI
1,870
4.1
7.0
11.9
Thailand
SET 50
1,188
2.8
8.5
20.0
USA
Dow Jones
25,521
2.8
9.2
27.2
UK
FTSE
7,443
(3.0)
(0.6)
3.8
Japan
Nikkei
23,275
2.2
5.8
19.6
Germany
DAX
12,785
(1.5)
(5.1)
9.7
France
CAC
5,365
0.6
(2.7)
12.6
Source: Bloomberg, Angel Research p68in4
Market Outlook
February 05, 2018
Research Team Tel: 022 - 39357800
DISCLAIMER
Angel Broking Private Limited (hereinafter referred to as “Angel”) is a registered Member of National Stock Exchange of India
Limited,Bombay Stock Exchange Limited and Metropolitan Stock Exchange Limited. It is also registered as a Depository Participant with
CDSL and Portfolio Manager with SEBI. It also has registration with AMFI as a Mutual Fund Distributor. Angel Broking Private Limited is a
registered entity with SEBI for Research Analyst in terms of SEBI (Research Analyst) Regulations, 2014 vide registration number
INH000000164. Angel or its associates has not been debarred/ suspended by SEBI or any other regulatory authority for accessing
/dealing in securities Market. Angel or its associates/analyst has not received any compensation / managed or
co-managed public offering of securities of the company covered by Analyst during the past twelve months.
This document is solely for the personal information of the recipient, and must not be singularly used as the basis of any investment
decision. Nothing in this document should be construed as investment or financial advice. Each recipient of this document should make
such investigations as they deem necessary to arrive at an independent evaluation of an investment in the securities of the companies
referred to in this document (including the merits and risks involved), and should consult their own advisors to determine the merits and
risks of such an investment.
Reports based on technical and derivative analysis center on studying charts of a stock's price movement, outstanding positions and
trading volume, as opposed to focusing on a company's fundamentals and, as such, may not match with a report on a company's
fundamentals. Investors are advised to refer the Fundamental and Technical Research Reports available on our website to evaluate the
contrary view, if any.
The information in this document has been printed on the basis of publicly available information, internal data and other reliable
sources believed to be true, but we do not represent that it is accurate or complete and it should not be relied on as such, as this
document is for general guidance only. Angel Broking Pvt. Limited or any of its affiliates/ group companies shall not be in any way
responsible for any loss or damage that may arise to any person from any inadvertent error in the information contained in this report.
Angel Broking Pvt. Limited has not independently verified all the information contained within this document. Accordingly, we cannot
testify, nor make any representation or warranty, express or implied, to the accuracy, contents or data contained within this document.
While Angel Broking Pvt. Limited endeavors to update on a reasonable basis the information discussed in this material, there may be
regulatory, compliance, or other reasons that prevent us from doing so.
This document is being supplied to you solely for your information, and its contents, information or data may not be reproduced,
redistributed or passed on, directly or indirectly.
Neither Angel Broking Pvt. Limited, nor its directors, employees or affiliates shall be liable for any loss or damage that may arise from
or in connection with the use of this information.